")
Sales leaders love quota attainment. It’s the default scoreboard for performance. Reps live and die by their number. Hit it, and you’re a rockstar. Miss it, and you’re a problem. Sound about right?
But, quota attainment is a lagging indicator. It only tells you what already happened. It doesn’t tell you why a rep hit (or missed) their number. It doesn’t tell you if they’re crushing deals or just getting lucky. It doesn’t show who is actually skilled vs. who is benefitting from better territories, inbound leads, or end-of-quarter discounting.
Sales teams that live and die by quota alone, continually make the same mistakes:
- Overestimating revenue forecasts
- Letting weak reps hide behind a single deal
- Forcing reps to hit their number at any costs.
Jump to:
- Tracking the Right Sales Performance Metrics
- Win Rate: The Best Predictor of Sales Effectiveness
- Average Deal Size
- Sales Cycle Length
- Average Days in Pipeline
- New Opportunities Per Month (NOP)
- Average Monthly Pipeline Size (AMPS)
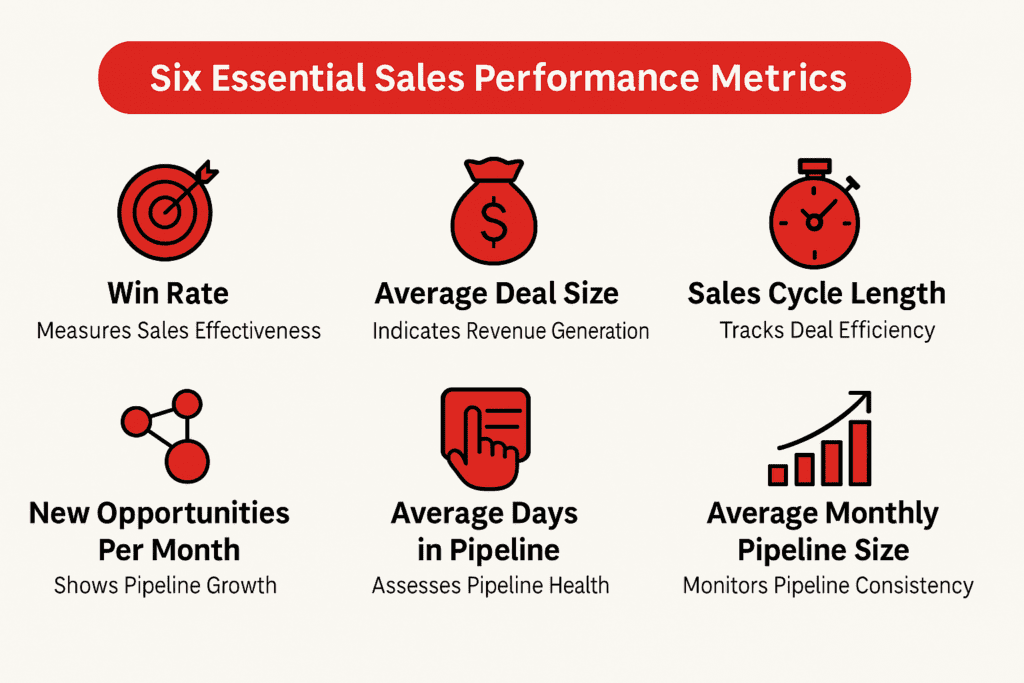
Tracking the Right Sales Performance Metrics
If you want to predict success, not just report on it, you need to start tracking leading sales performance metrics – the numbers that correlate with revenue growth, efficiency, and deal quality.
We’re going to break down six essential sales performance metrics that every CRO, VP of Sales, and sales enablement leader must track to fix pipeline issues before they hurt the bottom line.
As leaders, we need to build a repeatable, scalable revenue machine and that starts with tracking the right KPIs.
Win Rate: The Best Predictor of Sales Effectiveness
The Problem: Too Many Leads, Too Few Wins
Sales orgs love pipeline volume. How many deals are in the CRM, how much pipeline coverage exists, and how many meetings get booked. But, volume means nothing if your reps can’t convert.
If a rep’s win rate is low, they’re wasting opportunities. They’re either pursuing unqualified leads, failing to articulate value, or choking at the finish line.
A rep who closes 30% of their pipeline is far more valuable than one who closes 15% regardless of how many deals each is working.
The Fix: Track and Improve Win Rate
Win rate is the percentage of deals a rep wins out of the total number of opportunities they pursue. It’s one of the most critical sales performance metrics because it directly reflects the selling ability and not just effort.
How Sales Leaders Should Use It
Identify high potential reps: Reps with a high win rate and lower pipeline volume might need more leads. A rep with a big pipeline and low win rate probably needs coaching.
Spot pipeline waste: If win rates are below 20%, your team is either working bad deals or selling poorly. Either way something has to change.
Fix Forecasts: A team with a 15% win rate needs 6x pipeline coverage to hit quota. Increasing your win rates by just a few percentage points drastically improves revenue probability without needing more pipeline.
Win rates tell you who can actually sell and who just stays busy.
Weak close rates waste solid pipeline > Improve Deal Execution Here
Average Deal Size
The Problem: Reps are Discounting their Way to Quota
You’re tracking revenue, but are you paying attention to how much is left on the table? Reps hit quota, managers celebrate, but few ask how they got there.
If a rep hits quota by closing 50 small deals instead of 10 high value ones is that really a win? If another closes a handful of big deals but gives away 30% in discounts, what does that say about their selling ability?
Quota attainment doesn’t tell you the whole story – average deal size does.
The Fix: Optimize Average Deal Size
Average deal size reveals how well your sales team protects pricing and drives value based selling. It’s a sales performance metric that tells you:
- Who’s actually selling on value vs. who’s relying on discounting
- How deal size compares across territories, industries, and rep performance levels
- Which reps are consistently winning big deals and who’s churning through low value ones
How Sales Leader Should Use it
Identify chronic discounters: if a rep closes a high volume of small deals, they’re either too quick to cut price or hesitant to push for bigger opportunities. Find out which.
Align deal size with win rates: if a rep has a high win rate but a shrinking average deal size, they’re likely playing it safe, cherry picking small, easy to close deals instead of pursuing high value ones
Investigate company wide deal shrinkage: If average deal size Is dropping across the org, it signals training, discovery, or execution issues that need to be addressed.
Shrinking average deal size is a quiet killer. If you’re not tracking and improving this metric you’re losing millions in preventable leaks.
Sales Cycle Length
The Problem: Deals are Stalling and You Don’t Know Why
Revenue leaders naturally focus on closed-won deals, but do you pay attention to how long it takes to get there? Reps might hit quota but if they take twice as long as their peers to close their deals it’s probably hurting sales velocity, forecasting accuracy, and revenue predictability.
The longer a deal drags on, the more likely it is to stall, get derailed by new stakeholders, or lose urgency altogether.
The Fix: Optimize Sales Cycle Length
Sales cycles is a leading indicator of deal efficiency. It tells you how quickly your team can move a buyer from contact to close and, with a little digging, where deals are getting stuck.
How Sales Leaders Should Use It
Spot Bottlenecks in the pipeline: if deals consistently stall at the same stage, something is going wrong in the teams abilities.
Compare cycle length across reps: Are top reps closing faster because they’re better at discovery? Are struggling reps spending too much time on bad deals instead of disqualifying them out?
Improve forecasting accuracy: If your team routinely underestimates sales cycle length, revenue projections will always be overly optimistic leading to that last minute scramble to hit numbers.
If Deals Aren’t Moving, Revenue Isn’t Growing >>> Fix It.
Average Days in Pipeline
The problem: Your pipeline is full, but nothing is moving
Who doesn’t love seeing a full pipeline? But, if those deals sit too long without advancing, they’re not real opportunities.
Bloated pipelines create false confidence in forecasts, plus reps who hold onto deals too long are wasting time on opportunities that aren’t going anywhere.
The Fix: Track Average Days in Pipeline
Average days in pipeline measures how long open deals have been sitting in the pipeline before closing (won or lost).
How Sales Leaders Should Use it
Identify reps who won’t let go: if a rep’s average days in pipeline is higher than most, they’re likely clinging to dead deals instead of focusing on active buyers.
Align sales cycle and pipeline health: Deals shouldn’t linger past a reasonable threshold. If a deal has been in the pipeline 2x longer than the average sales cycle, the rep needs to do 2 things. First, move on. Second, qualify harder.

Stop Losing 80% of Your Pipeline to Poor Deal Management
Win rates are dropping, sales cycles are lengthening, and your CAC is soaring—all because deals lack proper management. This guide reveals why and how to reclaim millions in lost revenue.
New Opportunities Per Month (NOP)
The Problem: Reps are closing, but who’s filling the pipeline?
To answer the earlier question myself, everyone loves a full pipeline, but rarely do leaders know who is building it.
Reps love working inbound and late-stage deals, but if they’re not consistently adding new opportunities, revenue will dry up. You may not feel it this quarter, but eventually, it’s too late.
Many reps coast on pipeline momentum, closing what’s already in play but failing to prospect, source, or generate new deals. If you’re not tracking New Opportunities Per Month (NOP), you’re missing the first warning sign of a future revenue problem.
The Fix: Track and Optimize NOP
NOP measures how many qualified deals enter the pipeline each month, ensuring your team is always feeding the sales funnel with fresh opportunities.
How Sales Leaders Should Use it:
Spot reps who rely too much on inbound: If a rep’s NOP is consistently low, they’re not sourcing business, they’re just working what marketing hands them.
Align with quota attainment: If a rep misses quota and has a low NOP, they have a top of funnel issue. They’re not finding enough to work with.
Average Monthly Pipeline Size (AMPS)
The Problem: Your Pipeline is Inconsistent and So Is Your Revenue
You’ve heard about pipeline coverage, but are you tracking pipeline consistency?
Some reps grind out a strong pipeline one month, neglect it the next, creating wild revenue swings. Others operate on the boom or bust cycle, filling pipeline only after they’ve closed enough to free up some time.
Without consistent pipeline generation, forecasts become impossible.
The Fix: Track and Optimize AMPS
AMPS measures the total value of active deals in a rep’s pipeline on a monthly basis, showing pipeline stability and ensuring consistent flow.
How Sales Leaders Should Use it
Identify reps who cycle between feast and famine: If a rep’s pipeline spikes one month and drops the next, they’re likely prospecting only when forced to.
Spot early warning signs of revenue gaps: if AMPS trends downward across the team, future revenue is already at risk, fixing it now prevents a scramble next quarter.
Balance pipeline across teams: if one segments AMPS is significantly higher or lower, you may have a territory imbalance, lead distribution issue, or qualification inconsistency.

Hear Directly From 1,200 Buyers on What Works and What Doesn’t
Buyers are tired of seller-driven agendas and empty discovery questions. This report shows what they say works across outreach, discovery, and demos.
Conclusion: Sales Performance Metrics that Predict Sales Strength
Quota attainment is important, but it’s not the end all be all sales leaders want it to be. It only tells you what already happened. If you want to predict revenue, fix pipeline issues, and improve execution you need to track sales performance metrics that reveal what’s working and what’s broken before it impacts revenue.
Here’s what every CRO, VP of Sales, etc needs to track:
- Win Rate – tells you who can actually sell vs. whos burning pipeline
- Average Deal Size – exposes who’s protecting margins vs. who’s discounting their way to quota
- Average Days in Pipeline – Who’s holding on to bad deals
- Sales Cycle Length – Predicts forecast accuracy and revenue risk by measuring deal efficiency
- New Opportunities Per Month (NOP) – Ensures reps are actively feeding future revenue
- Average Monthly Pipeline Size (AMPS) – Prevents boom and bust cycles by tracking pipeline consistency
What Sales Leaders Should Do next:
- Audit your team’s sales performance metrics – don’t wait to see what happens at the end of the quarter. Allow yourself time to make changes before having to play catch up.
- Coach with real data – use these metrics to identify skills gaps
- Fix revenue leaks early – if a metric trends down, address the root cause now before it shows on the revenue report


0 Comments