

Sales enablement touches every rep, every deal, and every piece of content a buyer sees before they decide. No other function has that kind of direct reach into revenue, not marketing, not operations, not even the CRO’s own office. That should make enablement the easiest function in the building to justify.
Instead, enablement defends its budget every planning cycle, while a sales rep carries a number that determines their pay every quarter. The asymmetry comes down to how each function talks about its own work, not how much impact each one actually has.
Budget-Defense Language Versus Revenue Language
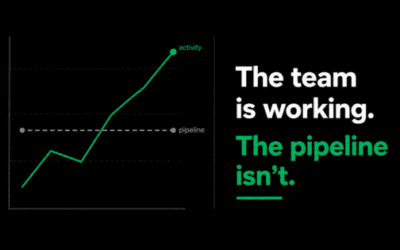
Most enablement teams report activity: hours of training delivered, programs launched, pieces of content produced, platforms maintained, new hires onboarded. That’s a summary of how the budget got spent. It reads as a request to keep the spending going, not as evidence the spending worked.
A different kind of sentence changes the conversation entirely. Ramp time fell three weeks for the last new-hire class, which put an additional $2.1 million in pipeline earlier in the quarter than it would have arrived otherwise. Win rate on deals where reps used a specific discovery framework ran 14 points higher than win rate on deals where they didn’t use it. Average deal size in a retrained segment moved up 22% quarter over quarter. Same underlying work. A completely different conversation, because the second version connects directly to a number the CRO already reports to the board.
Why Activity Reporting Feels Safer
Activity metrics are easy to produce and they always trend upward. It’s straightforward to get more people to finish a module or log into a platform, and the chart moving up and to the right feels like proof of progress. Reporting a hundred completed certifications takes no additional work beyond running the program. Reporting that those certifications moved win rate requires tracking which reps went through the program, which deals they worked afterward, and whether the outcome on those deals actually changed.
That second version of the report is harder to build. It’s also the only version that survives the moment a CFO asks the one question that ends every activity-based pitch: did any of this move the number.
The Marketing Precedent, and Where It Runs Out
Marketing solved this exact credibility problem roughly fifteen years ago. Before multi-touch attribution tools became standard, marketing was treated as a brand function: hard to measure, first in line for cuts when a board got nervous, always defending a budget with reach and impressions instead of revenue. Attribution tooling let marketing connect a specific campaign to specific pipeline to specific closed revenue. Marketing leaders who could show that math became strategic partners in the room. Marketing leaders who couldn’t got replaced.
The precedent has a real limit worth naming. Attribution never made marketing’s measurement problem disappear entirely. A third of marketing leaders still rank proving return on investment as the hardest part of the job, more than fifteen years into the attribution era, because customer journeys keep getting longer and more fragmented across channels. Building the same discipline in enablement won’t produce a clean, finished system either. It produces a hard measurement problem enablement has to keep working, the same way marketing still works its own version of it.
What It Takes to Isolate the Real Contribution
The hardest part of revenue language is proving the sentence is true, not writing it. Win rate, deal size, and ramp time all move for reasons that have nothing to do with enablement: a shift in the macro market, a change in territory assignments, a wave of rep attrition, a pricing change from finance. Crediting a training program for a win-rate lift that was actually driven by a stronger competitive position is the same mistake as blaming a rep for a loss the market caused.
The fix is a comparison, not a company-wide average. Comparing outcomes for reps who went through a specific program against reps who didn’t, in the same period, under the same market conditions, isolates enablement’s real contribution far better than a single before-and-after number for the whole team. That comparison takes more work to build than a simple headline stat. It’s also the only version that holds up when finance asks how much of the movement actually belonged to enablement.
What Changes Once the Work Gets Shown
Hiring changes first. A function measured on revenue movement hires people who know how to connect a program to a metric, not just people who know how to build content. Prioritization changes next: a request gets evaluated against whether it’s likely to move win rate, deal size, ramp time, or time to close, instead of getting built simply because someone senior asked for it.
The way enablement shows up to a QBR changes last, and it’s the most visible shift. Instead of presenting a summary of what shipped, the function presents a short list of metrics it moved, sitting alongside the same reps whose numbers it’s already measured against. That shift in how the work gets reported, laid out at length in Gap Revenue Performance, is what separates a function treated as a line item from one treated as a revenue driver.
Frequently Asked Questions
How does sales enablement prove its ROI?
By reporting specific before-and-after outcomes instead of activity volume: a reduction in ramp time tied to a dollar figure in earlier pipeline, a win-rate difference between reps who used a program and reps who didn’t, or a deal-size increase in a retrained segment. Each of these connects directly to a number a CRO already reports to the board, unlike hours of training delivered or certifications completed.
Why does sales enablement keep defending its budget every year?
Because most enablement teams report the work they did rather than what that work changed. Reporting activity feels productive because the numbers always trend upward, but it doesn’t answer the one question that decides budget: did this move a number the business cares about.
How did marketing solve the same credibility problem enablement faces now?
Multi-touch attribution let marketing connect a specific campaign to specific pipeline and specific closed revenue, instead of defending its budget with reach and impressions. Marketing leaders who could show that math became strategic partners; leaders who couldn’t got replaced. The same shift is available to enablement once it builds an equivalent measurement discipline, though attribution never fully solved the problem for marketing either — a third of marketing leaders still call proving ROI their hardest challenge.
How do you isolate what enablement actually caused versus other factors moving the same metrics?
Compare reps who went through a specific program against reps who didn’t, in the same period and under the same market conditions, rather than crediting enablement for the whole team’s movement on a metric. Market shifts, territory changes, rep attrition, and pricing changes all move win rate, deal size, and ramp time independent of anything enablement built.
What changes inside an enablement function once it starts reporting revenue impact?
Hiring shifts toward people who can connect a program to a metric. Prioritization shifts toward requests likely to move a specific number rather than requests that came from someone senior. Reporting shifts from a summary of activity to a short list of metrics the function actually moved.


0 Comments